Abstract
A weather station build around a SparkFun Weather Meter Kit (SEN-15901). The temperature, humidity and pressure are measured with I2C sensors housed in an RS1 Passive Radiation Shield from Garni. The data can be read via an RS485 ModBus RTU interface. The main processor is an Arduino Pro Mini (ATmega328P 5V@16MHz)
Why do you need a weather station?
Well, you don’t…because if you want to know the weather, you look on your phone. So why bother than? Because since the beginning of time, people are obsessed with the weather. When I was a child, my grandmother was measuring the temperature and rainfall on a daily basis. My grandfather had an allotment, so he also was very interested in the weather. The first thing my father read in the newspaper was the weather report and the last thing he watched on the television was… the weather report. And every hour he listed to the weather report on the radio. If he talked to someone he always started the conversation by talking about the weather. And when I open a new browser window, it automatically opens the weather page.
So the weather is fascinating and taking your own measurements is a lot of fun.
What should a weather station measure?
As my grandmother already measured temperature and rainfall, these ones are mandatory. And for the rest I looked at the website of the Dutch meteorological institute. They measure wind direction, average wind speed of the last 10 minutes, maximum wind gust of the last 10 minutes, rainfall of the last hour as well as the last 24 hours, temperature, humidity and atmospheric pressure.
Measurements
- Wind direction
- Wind speed (average of last 10 minutes)
- Wind gust (last 10 minutes)
- Rain fall (last hour)
- Rain fall (last 24 hours)
- Temperature
- Humidity
- Atmospheric pressure
What sensors do we need?
Wind and rain
Measuring wind and rain is difficult. Well, not if you want to do it by hand: place a beaker on the ground and wait a day. Than measure the amount of water in it. Empty the beaker and start again. And for the wind, you can stick a pole in the ground and attach a ribbon to it. The direction of the wind can than be made visible. And even the wind speed can be determent by measuring the angle between the ribbon and the ground.
But how to do this automatically? Of course you can buy a fancy commercial weather station. These are surprisingly cheap these days. But that’s not a challenge. Besides, than you buy into a proprietary ecosystem. And it probably only works when connected to the cloud. No thanks!
Building from scratch is an option, but I am an electronic engineer, not a mechanical one. I can imagine that won’t be a success. Besides going the professional route, which is ridiculously expensive, there is really only one option left: the SparkFun SEN-15901 Weather Meter.

But this contraption does not come with any signal conditioning. We have to make some kind of interface. Luckily, Sparkfun provides an Arduino library, so we only have to connect the SEN-15901 to an Arduino and run the code.
Temperature, humidity and air pressure
These three are easy: there are a lot of I2C chips capable of measuring these parameters. I choose the Silicon Labs Si7021 for humidity and temperature and the Bosch BMP280 for pressure. Just hook them up to the Arduino’s I2C bus, load the available libraries and Bob’s your uncle.
To mount these sensors on the same mast as the SparkFun weather meter I use the RS1 passive radiation shield from Garni.

Sensors
- SparkFun SEN-15901 Weather Station
- Silicon Labs Si7021
- Bosch BMP280
What to use for communication with the outside world?
Most consumer grade weather stations (and almost all other consumer grade goods for that matter) use proprietary interfaces and protocols. Probably to annoy the more technical skilled customer as you are not able to interface these devices with other brands or self build systems. I really hate that practice, so I won’t do that. Instead I will implement a ModBus RTU interface. Dating back to 1979, this is the industrial standard for communication between devices. And if the professionals all use it, why not use it for this weather station?
ModBus
ModBus is a client/server data communications protocol in the application layer of the OSI model. ModBus can work over several different physical interfaces. For this application I will use an RS-485 interface. This interface is easy to implement and cables can be very long, making it easy to locate the weather station. ModBus is a lightweight protocol which can comfortably fit inside an under-powered micro-controller like an Atmel ATmega328P. A simple RS-485 to USB dongle connected to a PC is all you need to read the values from the weather station.
What else?
Not much to be honest. Almost everything can be done in software. Of course we need a power supply. And preferably a reverse polarity protection. An input voltage of 12 Volt is convenient. 12 Volt power bricks can be found in every charity shop and you can also use a 12 Volt lead acid or lithium battery to power the weather station.
Theory of operation - Hardware

Wind speed
Measuring the wind speed is done by a cup anemometer. It consisted of three or four hemispherical cups on horizontal arms mounted on a vertical shaft. The air flow past the cups in any horizontal direction turned the shaft at a rate roughly proportional to the wind’s speed. Every rotation, a magnet passes alongside a reed switch. The rate at which the reed switch opens en closes is a measure of the wind speed.

By connecting one side of the reed switch to ground and the other via a pull-up resistor to the supply voltage the mechanical switching action is translated to an electrical pulse signal. This pulse can be read by a micro-controller.

Wind direction
Measuring the wind direction is done by a wind vane. It consists of a vertical blade mounted on a vertical shaft. Because the blade can turn, it will always find the position of the least air resistance. The shape of the blade is chosen so that it will always points directly to the wind. A magnet mounted on the shaft rotates past several reed switches. The switch that is closest to the magnet will close. If the magnet is precisely between two reed switches both switches will close increasing the resolution of the wind vane.

Each reed switch is connected to a resistor and every resister has a different value. The total resistance of the network will change according to the wind direction. By connecting one side of the network to ground and the other side via a resistor to VCC, a resisive divider in made. This resistive divider converts the variable resistance to an analog voltage which can be sampled by the A/D converter of a micro-controller.

| Direction | Resistance |
|---|---|
| 0° | 33kΩ |
| 22.5° | 6.57kΩ |
| 45° | 8.2kΩ |
| 67.5° | 891Ω |
| 90° | 1kΩ |
| 112.5° | 688Ω |
| 135° | 2.2kΩ |
| 157.5° | 1.41kΩ |
| 180° | 3.9kΩ |
| 202.5° | 3.14kΩ |
| 225° | 16kΩ |
| 247.5° | 14.12kΩ |
| 270° | 120kΩ |
| 292.5° | 42.12kΩ |
| 315° | 64.9kΩ |
| 337.5° | 21.88kΩ |
Rain fall
Measuring the amount of rain fall is done by a self-emptying tipping bucket. Rainwater is collected and funneled to a tipping bucket. The bucket tips over when a certain amount of water is collected. The bucket drains and a second bucket is automatically placed under the funnel. When a certain amount of water is collected in this second bucket it will tip over and the first bucket is raised again.

Every time the bucket tips over a magnet passes by a reed switch, which closes and opens again. As with the cup anemometer this mechanical movement can be translated to an electrical pulse by connecting one side of the switch to ground and the other side via a pull-up resistor to VCC. This pulse can than be read by a micro-controller.
NOTE The rain meter is very sensitive: even a small amount of movement and the bucket tips over. Mounting the rain meter in the mast together with the wind meters can cause false triggers from the rocking motion of the mast.

Humidity
Measuring the relative humidity is done by an electronic sensor based on capacitive sensing using polymeric dielectrics. The humidity sensor is a small capacitor consisting of a hygroscopic dielectric material placed between a pair of electrodes. Absorption of moisture by the sensor results in an increase in sensor capacitance. The opposite is also true: when the moisture disappears, sensor capacitane decreases. There is a direct relationship between relative humidity, the amount of moisture present in the sensor, and the sensor capacitance. The relative humidity is defined as the ratio of the amount of water vapor in the air at a specific temperature to the maximum amount that the air could hold at that temperature, expressed as a percentage. As the humidity sensor has a build in temperature sensor, it can calculate the relative humidity.

The Si7021 humidity sensor has an I²C bus for communication with a micro-controller.

Temperature
Measuring the temperature is done by the build in temperature sensor of the humidity sensor. This sensor is used by the humidity sensor to calculate the relative humidity. But as this sensor is very accurate it can be used for ambient temperature measurments.
Atmospheric pressure
Measuring the atmospheric pressure is done by an electronic sensor based on a piezo-resistive pressure sensing element. The piezo-resistive effect is a change in the electrical resistivity of a semiconductor or metal when mechanical strain is applied. In this case the strain comes from the atmospheric pressure. The sensor measures the resistance which is proportional to the atmospheric pressure.

The BMP280 pressure sensor has an on board temperature sensor which can also be used to measure the ambient temperature. As this sensor is less accurate compared to the sensor of the Si7021 humidity sensor, the sensor is only used as a backup sensor. The BMP280 has an I²C bus for communication with a micro-controller.

Illumination
This sensor is still under development.
ModBus interface
The RS-485 interface is build with a MAX485E driver chip from Maxim Integrated. Nothing much to say as the implementation is pretty much following the typical application from the datasheet.

If the device is the first or last device on the RS-485 bus, a 120 Ohm termination resistor can be enabled by placing a jumper on header J7.
The Arduino micro-controller can be programmed via an in circuit programmer, which shares the serial port with the MAX485E. Resistor R5 isolates the output of the MAX485 from the signal of the programmer.
I²C bus
The I²C bus is integrated in the micro-controller. But because the micro-controller uses a power supply of 5 Volt and the I²C sensors use 3.3 Volt a bidirectional level shifter is needed. This way the sensors can be used on the 5V I²C bus without the risk of damaging the sensors.

Let’s assume the I²C signal lines on either end of the MOSFETs are either outputting a logic high or is configured as an input. Effectively this means there is nothing pulling the signal levels down.
The voltage between the gate and source of both MOSFETs is at 0V (both are at 3.3V) so the MOSFET is switched off. Therefore both sides of the MOSFETs are logic high.
When either of the 3.3 Volt signal lines outputs a logic low the corresponding drain is pulled to ground. Now the voltage between the gate and the source is 3.3V and the MOSFET turns on causing the 5 Volt side to go low as well.
When either of the 5 Volt signal lines outputs a logic low the body diode of the corresponding MOSFET start conducting, causing the source voltage to drop below the gate voltage. The MOSFET switches on and the 3.3 volt side goes low.
Power supply
Typical, a 12 Volt power supply is used to power the device, but it can be powered from a wide range of voltages, from 6.5 to 36 Volt. A switching regulator (U3) supplies the 5 Volt power rail and a linear low drop regulator (U4) supplies the 3.3 volt power rail.

Input protection
C1 and C5 short out high frequency signals, protecting the input from ESD. Bidirectional transient-voltage-suppression diodes D1 end D2 clamp transient voltages, again protecting the input from ESD.
And than Q3 and its surrounding components: this is the reverse polarity protection. Usually, a series diode is used, but due to the voltage drop across such a diode it dissipates energy which is wasteful. The circuit with Q3 on the other hand has a very low voltage drop resulting in an almost zero loss solution.
If VCC is applied in the correct polarity, the source will immediately rise to the about VCC because of the body diode conducting.
The gate will charge towards -VCC with respect to the source through R1. When the gate reaches the threshold voltage the MOSFET channel will begin to conduct, and by the time the gate-source voltage reaches a few volts the MOSFET channel will be conducting almost all the current, the output voltage will be close to VCC. It continues to charge until it reaches about -10V at which point the zener diode begins to shunt significant current away from the gate.
In steady state with VCC on the drain the gate sits at -10V with respect to the source, and the MOSFET happily conducts in the reverse direction.
When VCC is applied in the reverse polarity, the body diode of the MOSFET cannot conduct. Only a small leakage current can flow from the source to the drain via resistor R1 and zener diode D3, which now acts as a normal diode. The gate and the source are now at almost the same potential and the MOSFET cannot conduct, protecting the device from reverse polarity.

Microcontroller
The heart of the circuit is an Arduino Pro Mini, which is basically an Atmel ATmega328P with a special Arduino bootloader, making it an easy platform for developing software.

Both the signals from the rain meter and the cup anemometer are connected to interrupt pins of the micro-controller. The signal from the rain meter is lightly filtered by C8. The output of the wind vane is connectd to an analog input of the micro-controller.
The ModBus address can be set by DIP switch J9.
Theory of operation - Software
Wind speed
The pulse from the cup anemometer is connected to an interrupt input of the micro-controller. Every time its logic level changes an interrupt routine is called. This routine increments a counter and checks how many time has passed since the previous interrupt call. If the previous call was more than 6 seconds ago, the wind speed is (almost) zero. If the previous call was just over 3 second ago the interrupt counter now holds the amount of pulses in three seconds. This value is stored and from that value the wind speed can be calculated. If the previous call was less than 3 seconds ago the measurement is still in progress and no further action is taken. A measurment period of three seconds is choosen because it is the standard as used by the Dutch meteorological institute (KNMI).

Wind direction
The analog signal from the wind vane is fed into the analog to digital converter of the micro-controller. The software samples this signal and determines which value from a lookup table is closest to the value from the ADC. The lookup table now gives the wind direction in degrees.

As the tolerances between micro-controllers can be high, the wind vane has to be calibrated in order to get a correct lookup table.
Rain fall
The pulse from the rain meter is connected to an interrupt input of the micro-controller. Every time a rising edge is detected an interrupt routine is called. This routine debounces the signal and increments the rain counter. This counter can be used to calculate the rain fall.
Humidity
Via the I²C bus, the humidity value of the sensor is read. As the sensor can become saturated with moisture it can get stuck at 100%. This happens in particular with fog or other high humidity and condensing weather types. The sensor has a build in heater to drive of moisture and thus preventing this problem. Because the temperature of the sensor rises when the heater is turned on, accurate ambient temperature and humidity readings are no longer possible. But with a smart algorithm it is possible to get the benefits of the build in heater while still being able to use the sensor as an ambient thermometer.
When the humidity rises above 95% for more than an hour the current temperature and humidity are stored and the heater is switched on for 5 minutes. Than the heater is switched off again. If after 15 minutes the humidity is still above 95% the heater is turned on again for another 5 minutes. But not before the temperature and humidity are measured and stored, as the sensor is now cooled off to ambient temperature. If the humidity is below 95% the sensor is free from moisture and the process is not repeated for another hour.
When the heater algorithm is active, the temperature and humidity values are updated every 20 minutes instead of every 2 seconds. Statis bit 0 (ModBus register 30014) indicated if the heater is on or off and status bit 1 gives the update rate of the temperature and humidity values.
This algorithm can be enabled by setting the HeaterCoil (see ModBus secion).

Temperature
The temperature is read from the humidity sensor as this sensor gives the most accurate temperature readings. When the heater is on (see section humidity above) the temperature readings are temporary stopped and only updated every 20 minutes. As a backup, the slightly less accurate temperature readings from the pressure sensor can be used.
Atmospheric pressure
Via the I²C bus, the atmospheric pressure value of the sensor is read. There is nothing further to say about this sensor: it is rather boring.
Illumination
This sensor is still under development.
ModBus interface
The weather station uses ModBus RTU over a simplex RS-485 line. For now, the ModBus address is hard coded as 14 in the software. The values are available in the input registers and can be read via function code 04.
Below an example of how to read the wind direction and enable the heater algorithm in Python using the minimalmodbus library.
#!/usr/bin/env python3
import minimalmodbus

# port name, slave address (in decimal)
instrument = minimalmodbus.Instrument('/dev/ttyUSB1', 14)

# register number, number of decimals, function code
wind_direction = instrument.read_register(1, 1, 4)
print(wind_direction)

# register address, value, function code
instrument.write_bit(0, 1, 5)
Input registers (read only)
Input registers are numbered 30001 to 39999 but have data addresses 0x000 to 0x270E. The measurements and order of the measurements are the same as for APRS weather reports. But of course we use SI units.
| Address | Description | Units |
|---|---|---|
| 00 | Device ID (0x5758) | NO UNIT |
| 01 | Wind direction | degrees * 10 |
| 02 | Wind speed (average of 10 minutes) | m/s * 100 |
| 03 | Wind gust (peak of last 10 minutes) | m/s * 100 |
| 04 | Temperature (two’s complement) | degrees Celcius * 100 |
| 05 | Rain last hour | l/m2 * 100 |
| 06 | Rain last 24 hours | l/m2 * 100 |
| 07 | Rain since midnight | NOT IMPLEMENTED |
| 08 | Humidity | percent * 100 |
| 09 | Barometric pressure | hPa * 10 |
| 10 | Luminosity | W/m2 |
| 11 | Snow fall | NOT IMPLEMENTED |
| 12 | Raw rain counter | l/m2 * 100 |
| 13 | Temperature (two’s complement) | degrees Celcius * 100 |
| 14 | Status bits | see table below |
NOTE Register 13 holds the backup temperature reading from the pressure sensor.
| Status bits | Description | logic 0 | logic 1 |
|---|---|---|---|
| 0 | Heater status | heater off | heater on |
| 1 | Temp/humidity update | every 20 minutes | every 2 seconds |
| 2 | Heater algorithm | disabled | enabled |
The ModBus registers are 16 bit wide. For better precision, some units are scaled by a factor of 10 or 100. This way, values with up to two decimal points can be stored as 16 bit integer values. Just divide by 10 or 100 to get the floating point values.
Output coils (write only)
Output coils registers are numbered 1 to 9999 but have data addresses 0x000 to 0x270E. The default value of a register is 0.
| Address | Description | logic 0 | logic 1 |
|---|---|---|---|
| 0 | Heater algorithm | disabled | enabled |
Prototype
I wanted to locate the weather station at about 100 meters from the house. That meant that interfacing the weather station was not just a matter of connecting a wire to it. And 100 meters is also a bit much for a wifi connection. As I already had experience with LoRa I opted for that. But not LoRaWAN, but LoRa APRS. This is a ham radio network that I often use. I even run my own digipeater. So LoRa APRS it is.

The weather station’s RS-485 interface is connected to a Raspberry Pi Zero 2W running the aprx digipeater software, as well as some specially written Python programs to interface the build in LoRa transceiver, the GPS module and the weather station itself. Every 10 minutes the digipeater will read the weather station’s registers and sends the data as PE1RXF telemetry messages (see https://www.meezenest.nl/mees-elektronica/projects/aprs_telemetry/APRS_protocol_nodes_PE1RXF.pdf) over the APRS network to a server, which presents the data in a Grafana dashboard. The digipeater can also send standardized APRS weather reports over the APRS network. But more about this project can be found here: https://www.meezenest.nl/mees-elektronica/RPi_LoRa_shield.html

As a housing for the prototype, I used an old beehive. These are weatherproof and I had one laying around.


Specifications
Wind
Wind speed is measured by taking 3 second averages from the cup anemometer and using these samples to calculate the average over a 10 minute periode.
Wind gust is measured by taking 3 second averages from the cup anemometer.
Wind vane has 8 main directions and another 8 directions in between. But these last do not have the same weight, eg. these positions are not as likely to be measured as the main directions. This is due to the construction of the wind vane: it has eight reed switches for the main directions and if the wind direction happens to sit exactly in between two reed switches, both switches are closed giving the extra 8 sub directions. Not great, but it is what it is…
Rain
Resolution: 0.2794 mm/impulseHumidity
Operating range   :  0 - 100 % RH
Recommended range : 20 - 80 % RH
Accuracy          : +/- 3 % RH (0-80 % RH)
                    +/- 4.5 % (max when > 80 % RH)

Heater to drive of moisture (can be enabled via ModBus)
Pressure
Operating range : 300 - 1100 hPa
Accuracy        : +/- 1.0 hPa (0 - 65 °C)
                  +/- 1.7 hPa (-20 - 0 °C)
Temperature
Main sensor
-----------

Operating range : -10 - 85 °C (typ)
                  -40 - 85 °C (max)
Accuracy        : +/- 0.3 °C (typ)
                  +/- 0.4 °C (max)
                  +/- 0.5 °C (max when < -10°C)

Backup sensor
-------------

Operating range :   0 - 65 °C (typ)
                  -40 - 85 °C (max)
Accuracy        : +/- 0.5 °C (25 °C)
                  +/- 1.0 °C (0 - 65 °C)
ModBus
Physical : RS-485 simplex RTU
Settings : 9600 bd 8N1
Address  : 14
Schematic

Problems I encounter after four months of use
Humidity sensor
The Si7021 humidity sensor is not made for outdoor use. The datasheet is clear about that. But a lot of people use this cheap sensor for weather stations anyway. So I choose this sensor for my design. But that was not smart. After an initial time without any problems, the sensor started to saturate. This happened during a very wet and mild winter we had. My first solution was to utilize the build in heater to drive of the moisture. That worked, but only for a short period. The heater blew up and the sensor started to report humidity levels above 100% and because of a bug in the firmware of the sensor, the humidity register wrapped around and the sensor reported humidity levels of 0-30%. I tried to find a software solution, which worked for a while, but the sensor deteriorated even more. To the point of being totally useless. So I searched for another, better sensor. And I found the HYT-221 from Innovative Sensor Technology. This sensor is designed to work outdoors and can even be used in saunas, where the humidity levels are always high and the air is condensating. The datasheet specifically mentions outdoor weather stations as an application. The only downside is its price: it is ten times more expensive than the Si7021.
The sensor can be controlled via the I2C bus, so implementing the new sensor in the firmware was very easy. From version 0.3.0 onward, this sensor is used. The Si7021 is removed from the code.
Pressure sensor
After a year the BMP280 pressure sensor started to give odd pressure values. The pressure was around 700hPa and followed the temperature curve. The temperature sensor still worked fine. After replacing the BMP280 the barometric values returned to normal. I suspect that it malfunctioned because of the perpetual fog we had for about two months. The sensor was mounted in the Garni RS1 Passive Radiation Shield. Rain could not enter the shield, but fog could.
Additions
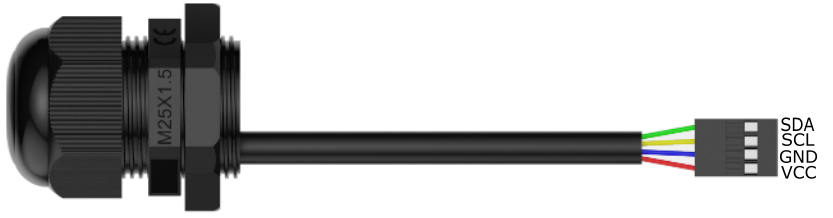
Luminosity sensor
From version 0.3.1 onward, the weather station has an ambient light sensor. It is an SEN0562 from DFRobot and it outputs the light intensity in Lux. It is a 5 Volt only device, so it should be connected to the 5 Volt I2C bus.
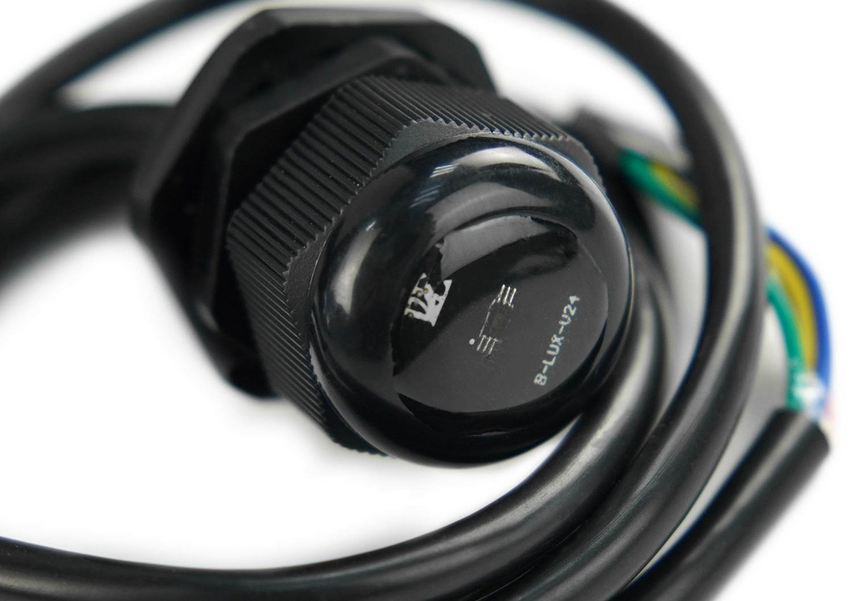
The sensor has the following specifications:
- Supply Voltage: 5V
- Operating Current: 1µA
- Detection Range: 1 - 65535lx
- Accuracy: 1.2lx
- Communication Mode: I2C
- Operating Temperature: -40 to 85°C/-40 to 185℉
- Waterproof Rating: IP68
- Thread Length: 10mm
- Cutout Size: 26mm
- Wrench Size: 31mm
- Cable Diameter: 3mm
- Wire Length: 1m
Sample code:
#include "Wire.h"
#define address 0x23 //I2C address 0x23
void setup()
{
Serial.begin(9600);
Wire.begin();
}
uint8_t buf[4] = {0};
uint16_t data, data1;
float Lux;
void loop()
{
readReg(0x10, buf, 2); //Register address 0x10
data = buf[0] << 8 | buf[1];
Lux = (((float)data )/1.2);
Serial.print("LUX:");
Serial.print(Lux);
Serial.print("lx");
Serial.print("\n");
delay(500);
}
uint8_t readReg(uint8_t reg, const void* pBuf, size_t size)
{
if (pBuf == NULL) {
Serial.println("pBuf ERROR!! : null pointer");
}
uint8_t * _pBuf = (uint8_t *)pBuf;
Wire.beginTransmission(address);
Wire.write(®, 1);
if ( Wire.endTransmission() != 0) {
return 0;
}
delay(20);
Wire.requestFrom(address, (uint8_t) size);
for (uint16_t i = 0; i < size; i++) {
_pBuf[i] = Wire.read();
}
return size;
}Software dependencies
- Arduino IDE
Arduino libraries
- https://github.com/sparkfun/SparkFun_Weather_Meter_Kit_Arduino_Library
- https://github.com/orgua/iLib
- https://github.com/epsilonrt/modbus-arduino
- https://github.com/epsilonrt/modbus-serial
Libraries are included with the source code of this project
License
Copyright (C) 2023-2025 M.T. Konstapel
The software is published as open-source software (GPL). The hardware is published as open-source hardware (OSH).
Software
This program is free software: you can redistribute it and/or modify it under the terms of the GNU General Public License as published by the Free Software Foundation, either version 3 of the License, or (at your option) any later version.
Hardware and documentation
This work is licensed under a Creative Commons Attribution-ShareAlike 4.0 International License.